Insights is currently in beta.
What kind of data will I see?
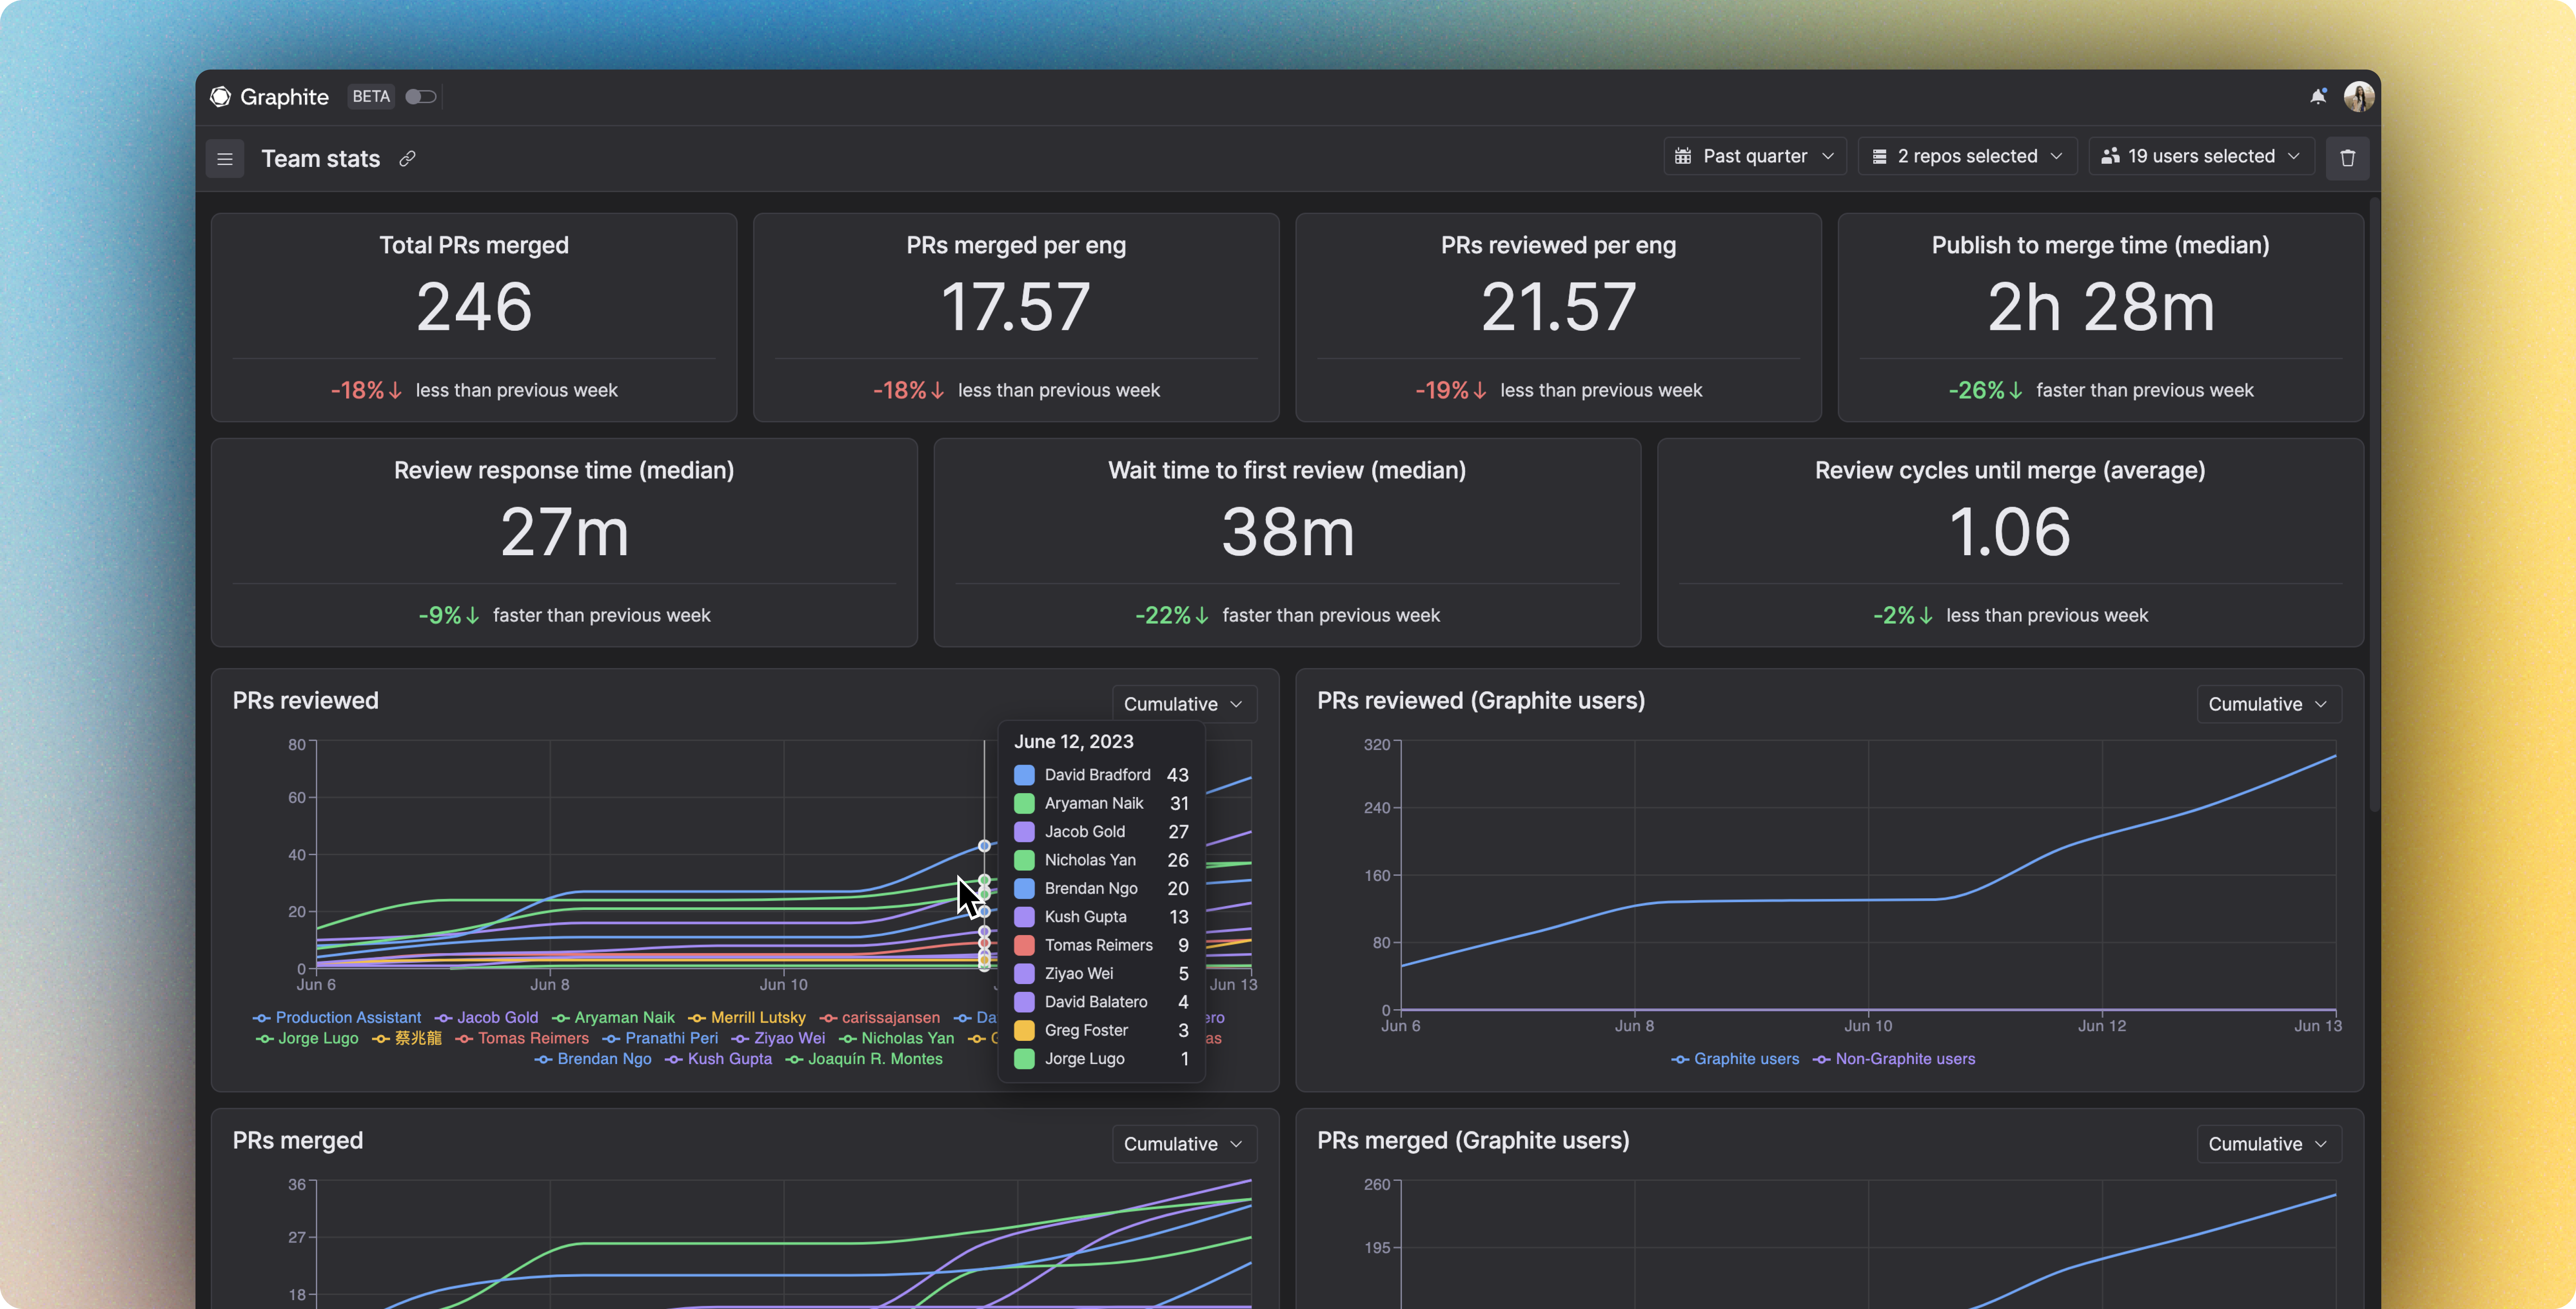
For selected users (aggregated):
-
Total PRs merged
-
Average number of PRs merged per person
-
Average number of PRs reviewed per person
-
Median publish to merge time
-
Median review response time
-
Median wait time to first review
-
Average number of review cycles until merge
-
(Graph) Number of PRs reviewed per person over a time period
-
(Graph) Number of PRs reviewed by Graphite users vs. non-Graphite users over a time period
-
(Graph) Number of PRs merged per person over a time period
-
(Graph) Number of PRs merged by Graphite users vs. non-Graphite users over a time period
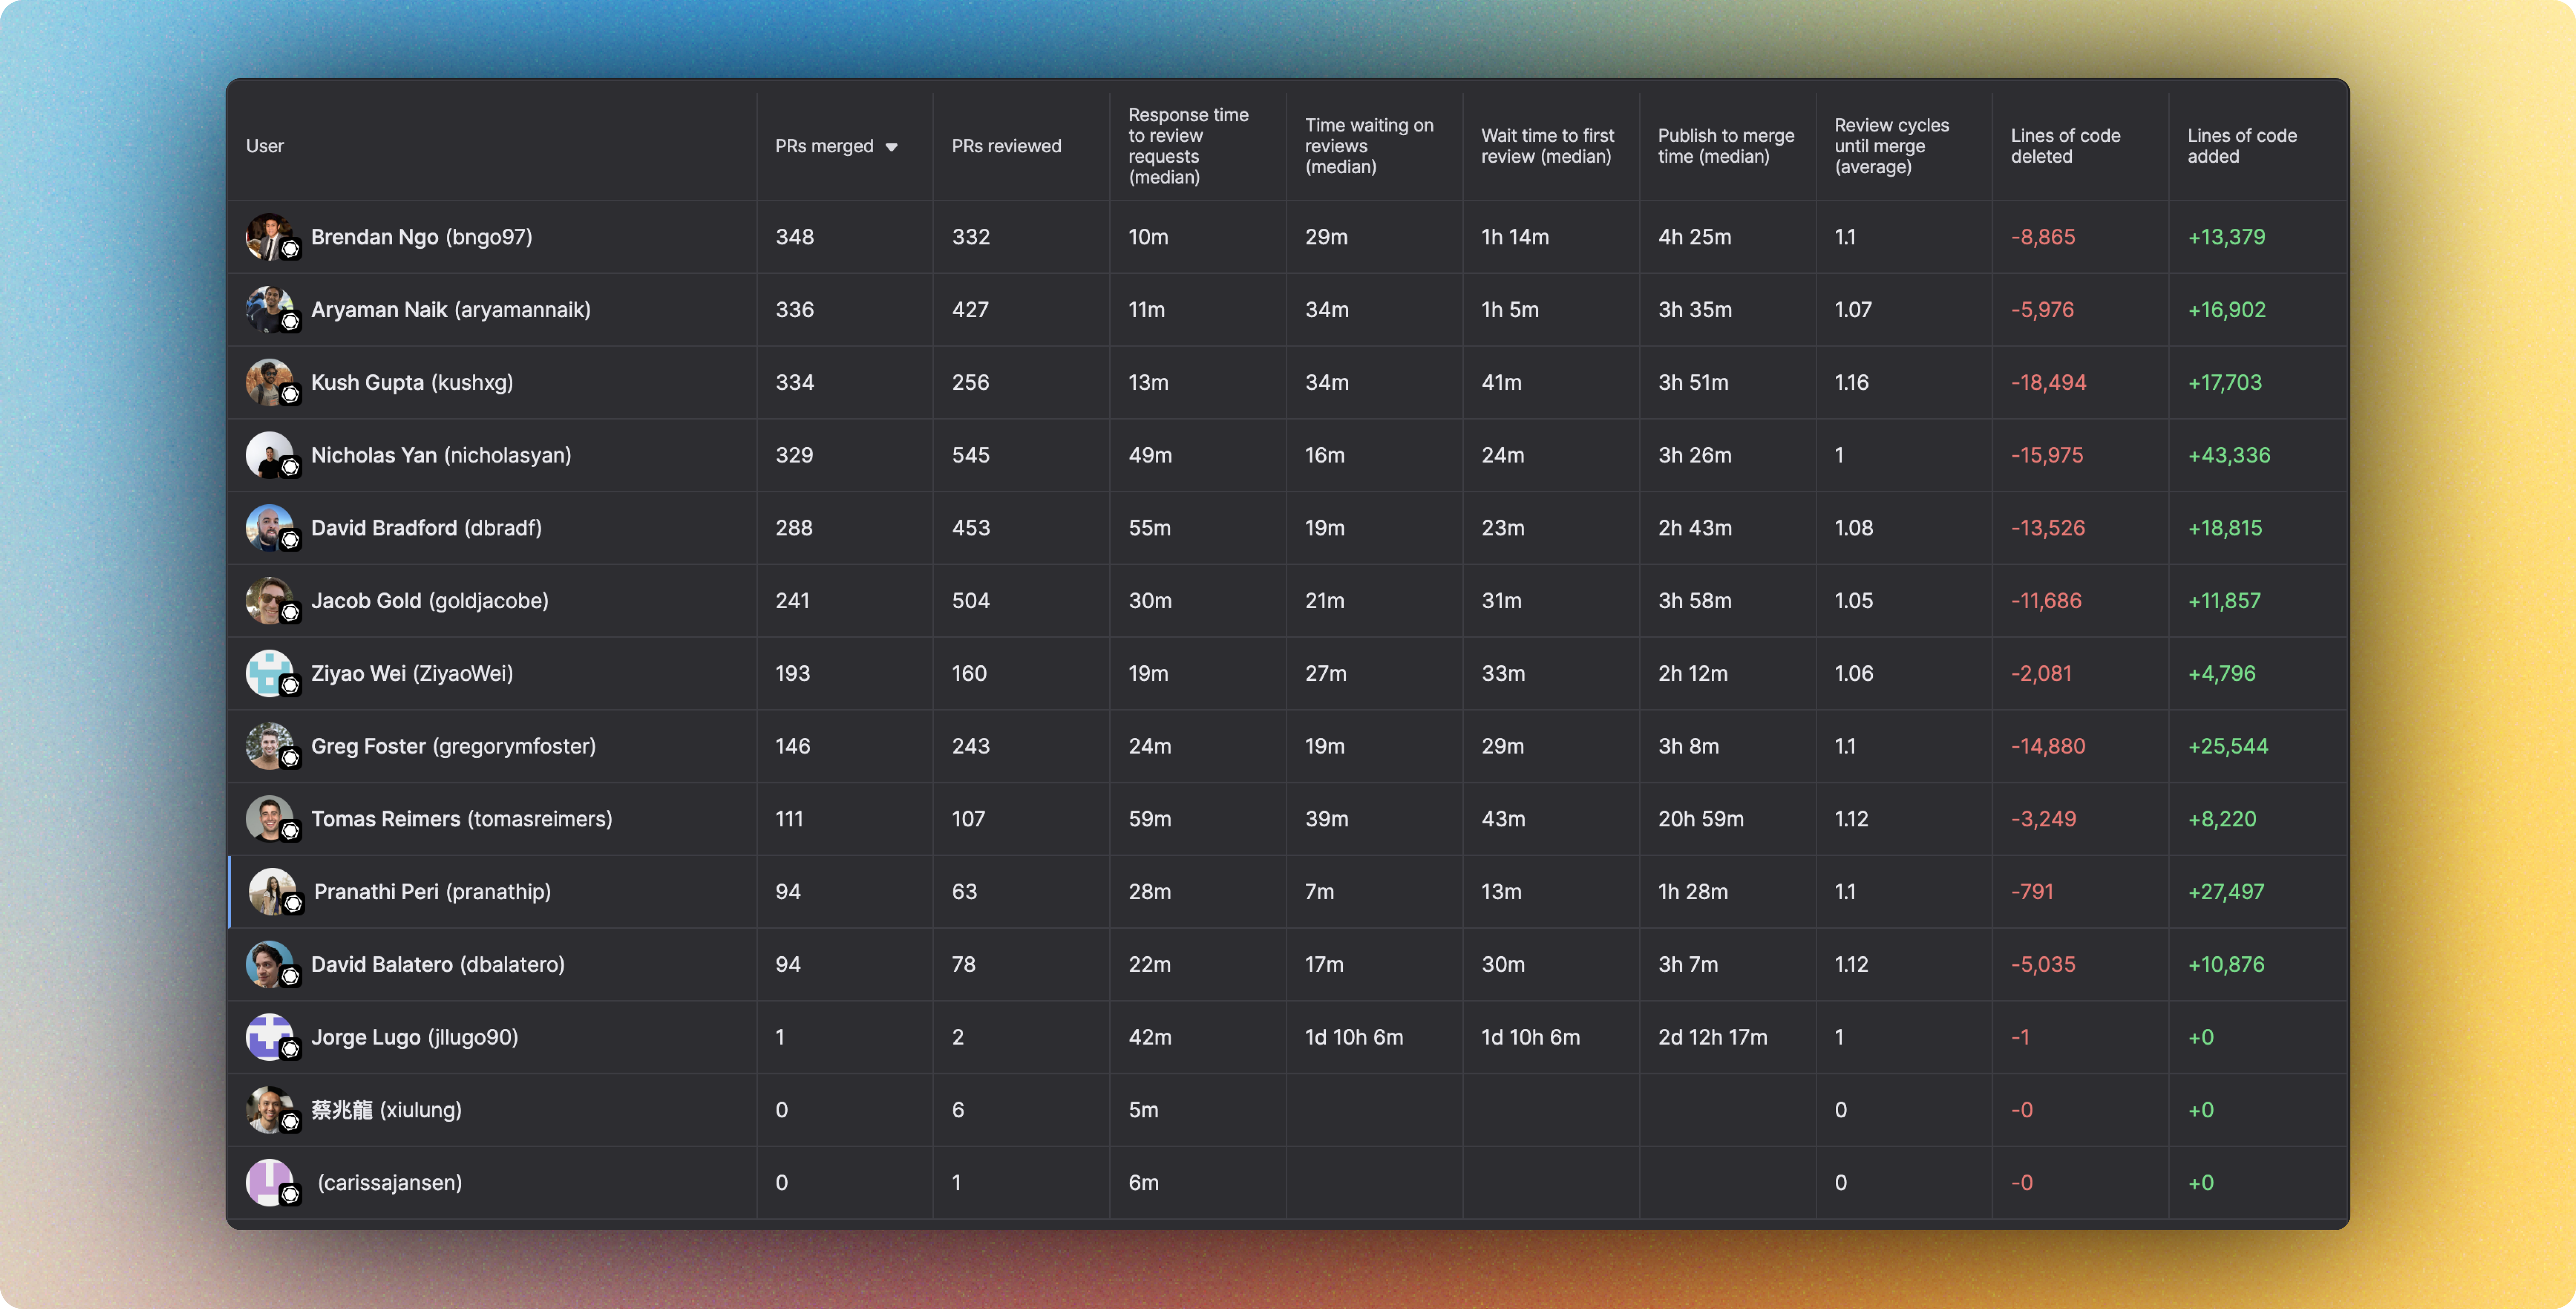
For each individual user:
Adjust the Insights time period
The statistics that are shown on the Insights page are aggregated over a specific time period. Graphite provides four fixed time periods for your convenience: the past week, month, quarter, or year. You also have the option to input a custom time period.
Each Graphite plan includes a defined sync period for historical GitHub data. The Starter plan includes insights going back up to 2 months. The Standard and Enterprise plans include up to 2 years.
Select users
You also have the ability to filter and view insights for specific people or groups of people, as well as the aggregate across your entire organization.